Everyday analytics

Why data should be organized to power your daily routines
Here’s the thing about databases: no one wakes up and thinks “huh, I really need organized data.”
Of course, they do need it. However, this need often manifests itself through different symptoms:
- Processes are inefficient: people take a lot of time doing repetitive tasks, human errors are constant afflictions and there’s a lot of waiting around for information;
- Important matters go unattended: stuff get lost amidst a flood of unorganized data, and the team has to juggle an infinity of requests while dealing with crises on a daily basis;
- No one knows how things are right now: teams have to wait for the next report to understand how things are going, and then it’s too late to do anything about it.
Those are common troubles that are much more recognizable, and most companies have suffered them at one point or another. Still, it’s hard to understand that those are symptoms of unorganized data. More often than not, companies will try to counter these problems with palliative solutions: hiring more people, increasing the frequency of reports, hasher compliance checks.
Building a good structure organizes your data and keeps it organized. It minimizes errors and speeds things along. But, more importantly, organized data can be immediately useful through dashboards and reports to power your team’s routines.
Dashboards give you actionable insights
There’s no thing like real time data to boost performance or improve the speed you can react and adapt to changes.
A dashboard can provide you with valuable insight to understand how strategies are paying off, or problems that may be creeping up the horizon.
Here are some questions that probably haunt your team daily:
- Which marketing strategy is working better? Is there any that isn’t working at all?
- What’s our conversion rate from New Lead to Won?
- How long are we taking to answer customer’s requests?
- Is there a pattern to the bugs users are reporting?
Having answers to those questions would allow you to change failing strategies and double down on effective ones. However, most of the time this information is just not easily available.
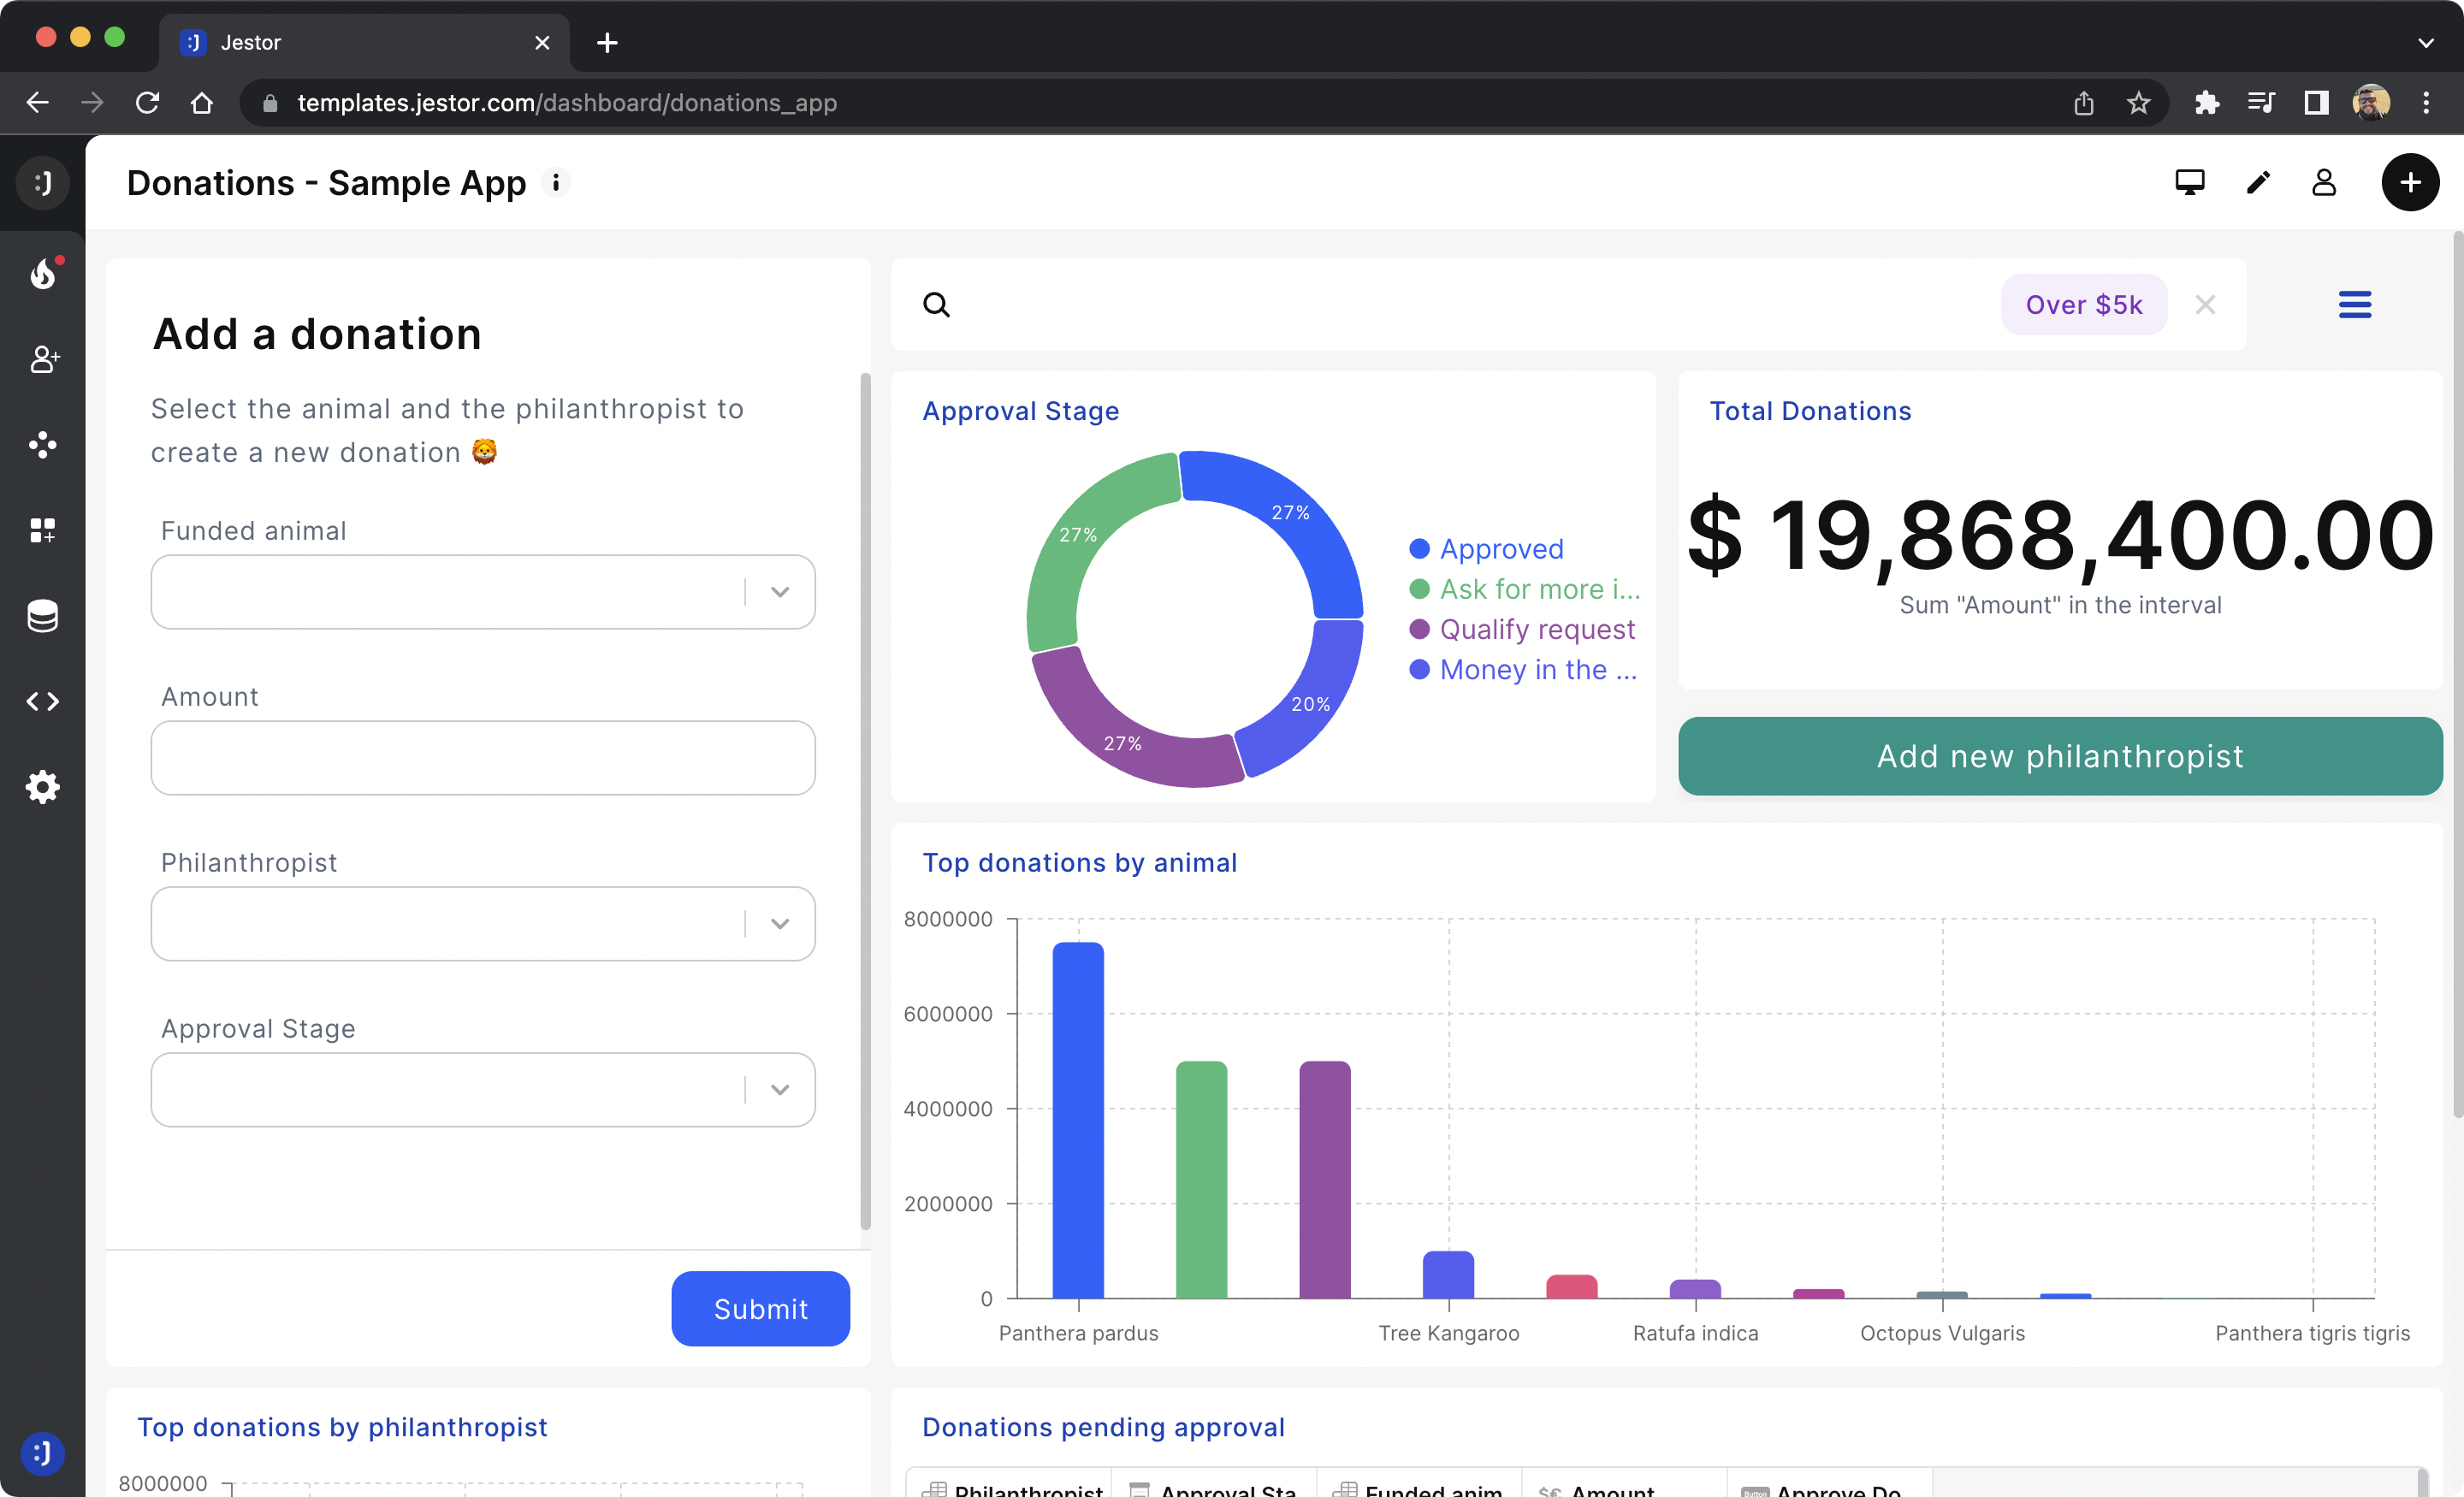
An organized database lets you create dashboards with the most important information and, more importantly, up-to-date information. That could be a pie chart for Leads by Status, performance indicators or even a calendar that shows only the Urgent tasks. It doesn’t matter: if you have data organized, you can display it in a helpful manner.

Jestor empowers teams even further by allowing you to build as many dashboards as you want. Having access to the Marketing, Projects and Sales dashboards can be clunky, but having your own personal dashboard that shows you the marketing, projects and sales data that is relevant to you works flawlessly.
Customizable reports save you precious time
While dashboards can give you insights quicker, sometimes you need to condensate information in reports or extract data fast. This is where customizable reports come in handy.
In jestor, you can create two types of reports: list and grouped reports.
List reports are data in its purest form: they’re basically a table filtered to predetermined conditions. So, if you need a quick summary of every reimbursed expense or invoices sent, for example, you may just create a report to that effect.
Grouped reports let you group data by some variable. So, if I need to know something like total amount by client, I can just create something to that effect:
Every Report set up is saved, so you can just click on it later and it’ll bring you updated information following that criteria:
You can then share that Report with other people, edit it, apply filters or change the period analyzed on the go. With just one click, you’ll have all the information you may need to make an important strategic decision.
Setting up your everyday analytics
Check out our documentation to understand how to build components and use organized data to boost your performance.

